

Warning: This article is based on three assumptions. First, the reader is an ambitious small business owner who owns a website. Second, the reader wants the website to be a thriving asset. Third, the reader loves reading cool, informative stuff. That’s you, isn’t it?
Many small business owners in the US (and everywhere else) work themselves silly to stay profitable. Wearing multiple hats? That’s all part of the biz. You’re the strategist, the marketer, the customer service rep, and sometimes even the janitor.
But it may be time to add one more—the web analyst.
And before you start thinking this sounds complicated or expensive, take a deep breath. Web analytics is remarkably simple, incredibly affordable (often free!), and typically requires minimal technical effort.
What is Web Analytics?
Web analytics is the collection, measurement, and analysis of data created by users interacting with your website. In the right hands, it works like a crystal ball, letting you measure user behavior and improving user experience.
When web analysis is working at full throttle, it might be the most impactful part of business intelligence.
Nothing else, for example, other than web analytics, tells you what your traffic source is. You might think your visitors flock in through Instagram, but only a web analysis report can confirm or disprove that theory.
Yet, a traffic source is just one slice of data web analytics provides. Many more include pageviews, bounce rates, and average session duration.
3 Pillars of Website Analytics

All website analysis revolves around just three things:
- Collecting customer data
- Analyzing that data (i.e., deciding whether the data reflects reality)
- Making business decisions based on the data
1. Collecting Data
I get it. You trust your gut. You’ve built your business from scratch, and you did it favoring an approach that data-rich, bigger competitors don’t value.
But data allows you to compete more effectively. Take the shift toward sustainability as an example. One day, everyone wants fast fashion; the next, it’s all about thrifted or ethically made clothing.
If you’re unwilling to listen, your business ultimately loses out. The big guys at Amazon, Meta, and Netflix get this.
There’s proof that data-oriented small businesses see results. Half of business owners in a Deloitte survey said analytics helped them make better decisions.
Legal Considerations When Collecting Data
Compliance with privacy laws (such as GDPR) is essential when collecting and processing personal data, including many of these metrics. With over 20 U.S. states now having comprehensive privacy regulations (most notably the California Consumer Privacy Act, CCPA ), collecting data ethically and transparently is crucial. Transparency means being upfront with people about what you’re using their data for.
Metrics aside, if your business collects sensitive data from people (as is often the case with professional service providers), you must understand applicable data protection laws, have a Privacy Policy, and consult a compliance professional.
Getting the best out of web analytics means, at the very least, that your website collects cookies—a form of data. So, data protection is not something to overlook.
Further reading
Legal requirements for collecting personal data
GDPR and Very Small Businesses
2. Analyzing Data
If some part of you is thinking, ‘Oh. Data is great, but where on God’s green earth am I going to find these metrics or make sense of them?’ You can stop worrying now, Hermione Granger. No need to master an advanced spell for this one!
When storing and analyzing web data, you only need a data analytics tool. In the context of small business websites, the standout option is Google Analytics 4 (GA). Nearly half of all websites (around 2 billion) use GA for a reason.
The whole thing is simple, really. Google Analytics is free and setting up an account (we’ll break it down later in this article) is almost as easy as creating a regular Google account.
Google Analytics 4 assigns each site user with a personal ID. That ID allows you to study customer behavior up close and discover the metrics we’ve discussed. For example, you can get impressive details on a site user’s age, location, and interests just from Google Analytics.
Note to you:
Your expertise in your industry still counts a lot. GA will collect the data, visualize it, and possibly clean it, but you must still interpret it and make business decisions.
Further reading
The Ultimate Guide to Google Analytics 4 in 2024 [Hubspot]
What is Data Analytics? A Complete Guide for Beginners [Career Foundry]
3. Making Business Decisions Based on Data
The true essence of data is informing good decisions. No point in collecting and analyzing web data if it won’t help improve business performance and profitability.
All the big guys (Amazon, Walmart, IBM) decide business actions based on data. They even have a fancy name for it DDDM (Data-driven Decision Making.)
Without spending any money, you can operate on the same principles as they do. Rather than make all business decisions solely on your gut, allow data to play a meaningful role.
Your gut was responsible for that horrendous show you watched the other day, right? I wouldn’t trust it all the time, either.
Starbucks always uses location analytics to decide where to plant a store. Why shouldn’t you use web analytics (for free) to figure out what your customers want?
Web Analytics in Practice: Key Metrics to Look For

This is where we get practical—down to brass tacks.
You’re a small business owner. You don’t need a hired gun, a fancy certificate, or the entire Google Analytics package to collect data and make sense of it.
What you need, as a small business owner, is precise metrics.
Consider metric data such as screen resolution (available in the Tech Review Report of GA4). For a giant e-commerce store, it’s a valuable metric, but for a small-time baker (who makes an irresistible apple pie), that’s kind of unimportant.
Generally speaking, a metric that tells you more about these four areas—engagement, traffic, users, and visibility—deserves your attention.
1. Engagement
Let’s say you strongly feel that if people knew your business’s ‘Why?’, they’d interact with it more. Using this gut feeling, you spend hours crafting the perfect ‘About Us’ page.
A business decision has been made. Great. But now, you must follow up by assessing metrics that confirm or disprove the truth of your theory.
These engagement metrics do more than help in this regard.
Conversions
Conversions, called ‘key events’ in GA4, equals the number of people who completed an action on your website, such as making a purchase, signing up for a newsletter, or filling out a contact form.
You get to decide what conversion means for you, depending on your business needs and product/service offerings. In deciding what conversion means for you, it’s best to choose an action with a measurable impact on your business growth.
You can track up to 30 conversion actions if you want to. Google Analytics lets you set events (i.e., actions that matter to you) so you can measure precisely what you want, including:
- Automatically collected events like pageviews (page_view) or views on an embedded video (video_complete)
- Recommended events like newsletter signups (sign_up)
How to Set Up An Event (Conversion Action) on Google Analytics
- Log into Google Analytics. Go to Admin.
- Select your Property. Then navigate to ‘Events.’ Click ‘Create Event’ to create a new event. Describe the event you’d like to track in simple words. Please note that you can only use letters, numbers, and underscores. No space is allowed.
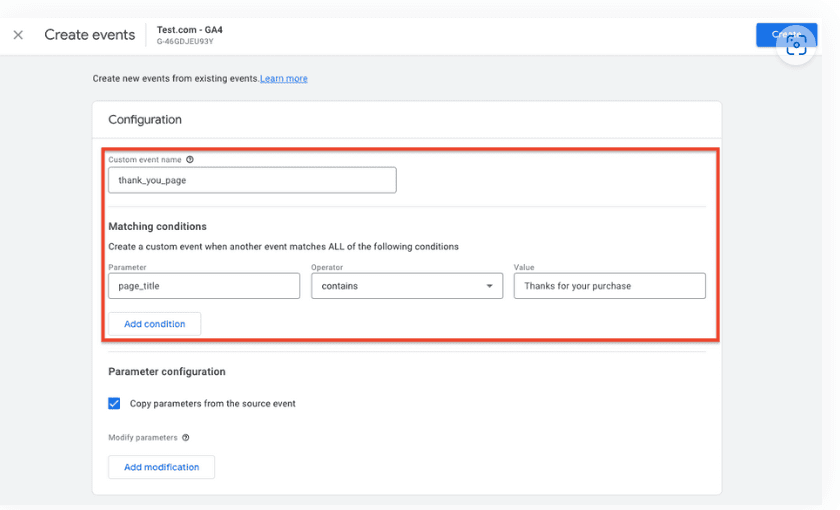
- Next, define the conditions for triggering the event by setting parameters that describe its attributes, such as page_title, page_location, item_category, or success.
For example, you could configure the thank_you_page event to activate when the page_title parameter includes the phrase ‘Thanks for your purchase.’
While GA4 automatically collects many standard parameters, you can also configure custom parameters to suit specific needs.
A GA4 event is not yet a conversion, or key event, until you ask GA4 to make it one. Here’s how:
- Go to the Admin panel in the bottom left
- Under ‘Data Display,’ click ‘Events’ to see all your existing events.
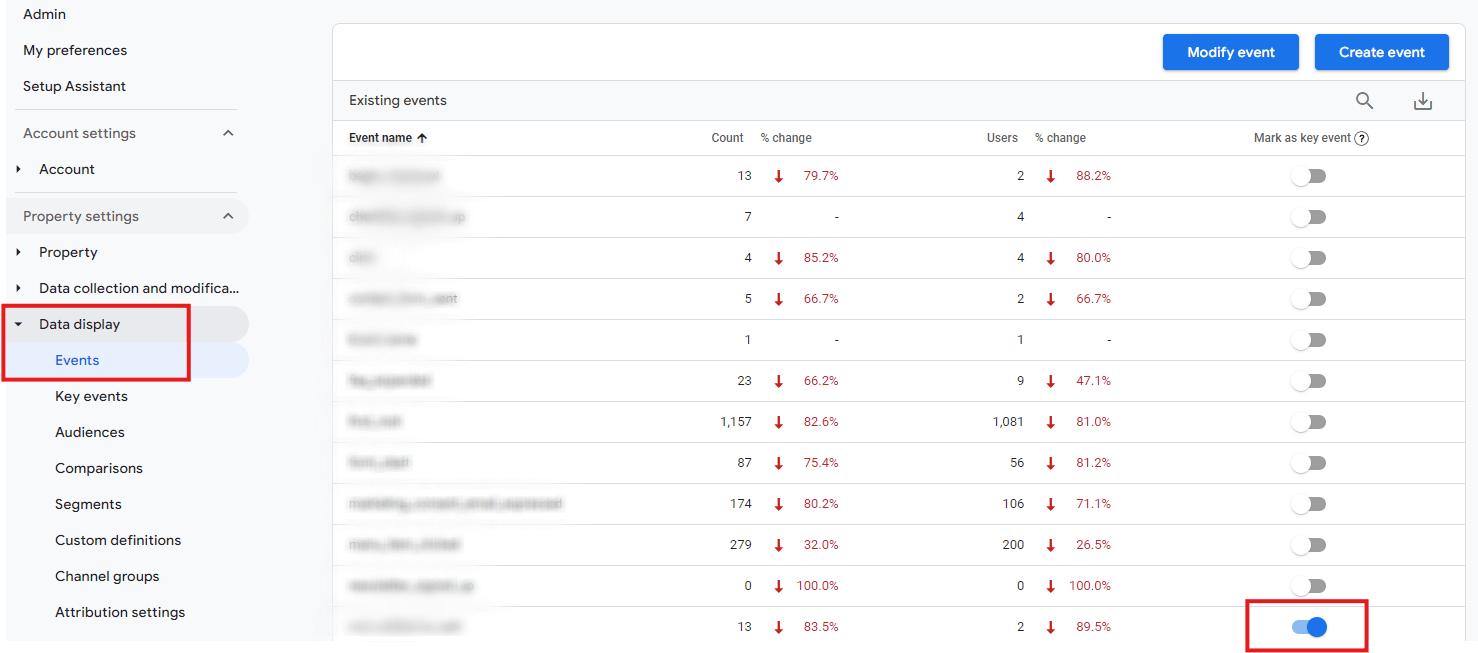
- Find the ‘Mark as key event’ column and click the toggle to turn an event into a conversion event. GA4 will only track a conversion event only when you identify it as one.
How to View Conversions
Once Google Analytics 4 (GA4) has collected conversion events, you can access 3 Lifecycle reports to analyze them: the Acquisition, Pages and screens, and Landing page reports.
To view the conversions in the Landing page report as an example:
- Go to Reports > Life cycle > Engagement > Landing page in the GA4 dashboard.
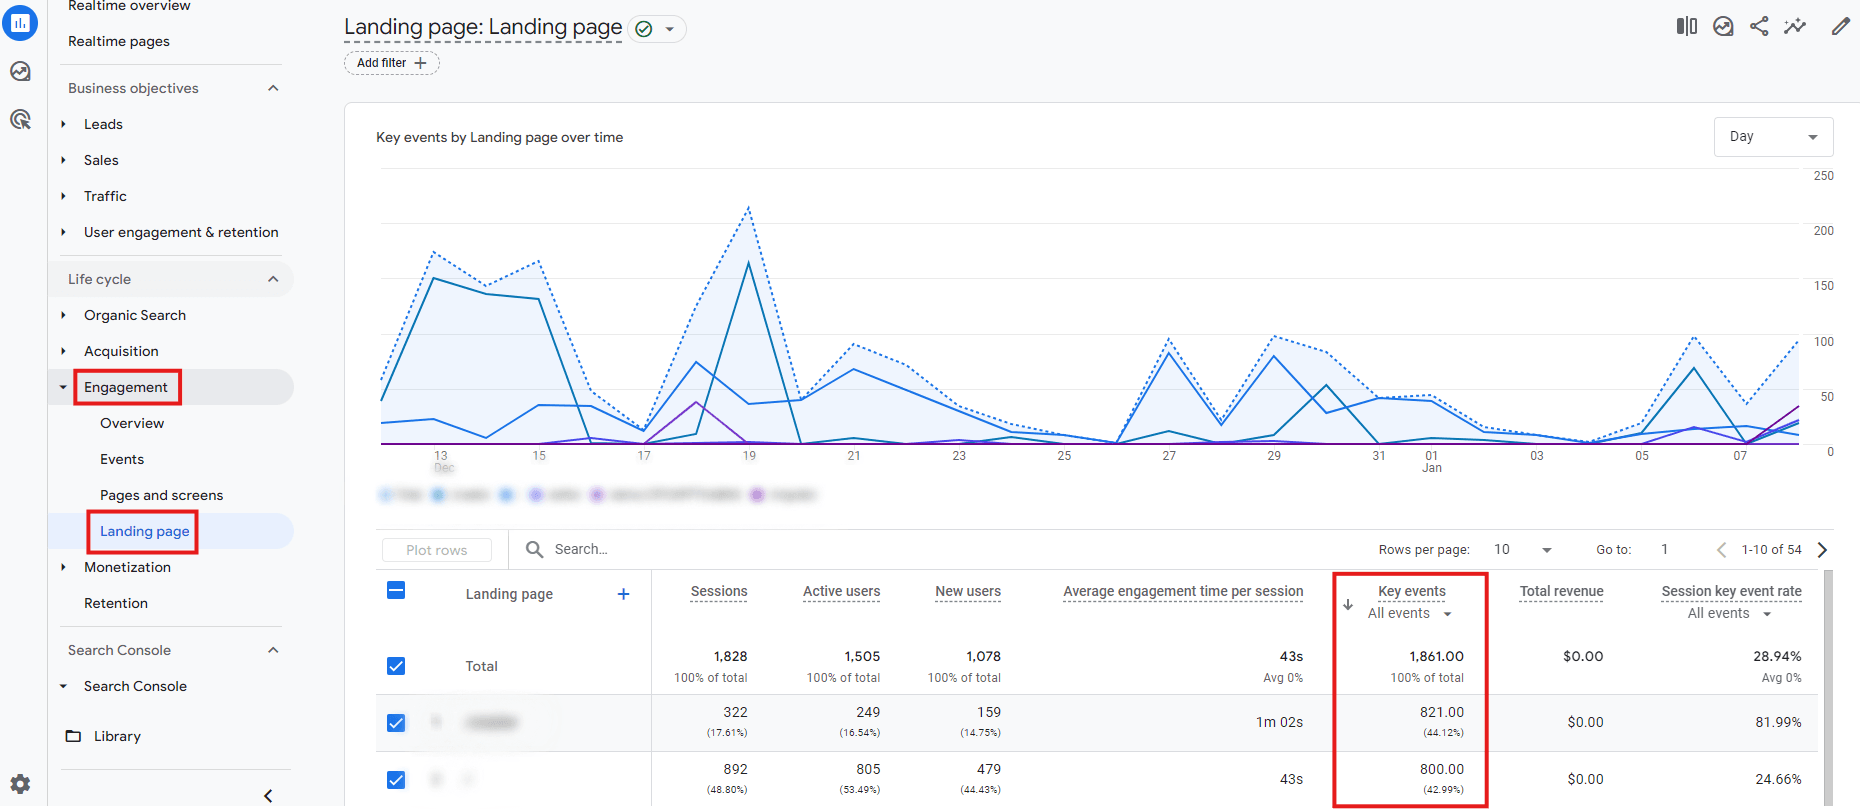
- Select a specific timeframe to see how many conversions each landing page has generated.
- Click on the ‘Key events’ column to select from the dropdown filter which conversion you’re particularly interested in.
Views Per User / Pages Per Session
Views Per User tracks the average number of pages a visitor views during a single session on your website.
Like average session duration, a higher page per session value may indicate that visitors love your content and want to explore more areas of your site.
That’s a great sign because users who interact with more pages are more inclined to take desired actions, such as making a purchase or filling out a contact form.
The best thing about this metric is that it tells you how effective your content is. If a blog post attracts multiple pageviews, you know it’s striking the right chord.
Many SEO experts agree that to improve your views per user, you need to do two things—optimize your website for mobile devices (easy if you use _now AI website builder by cyber_Folks) and leverage internal linking, which is basically connecting one page of your website to another through hyperlinks.
How to View Views per Session
- Go to Reports > Life cycle > Engagement > Landing page in the GA4 dashboard.
- Select the pen icon to the top right (‘customize report’).
- Go to Metrics, Add metric, type ‘Views per session,’ select and hit Apply, then finally Save > ‘Save changes to current report.’
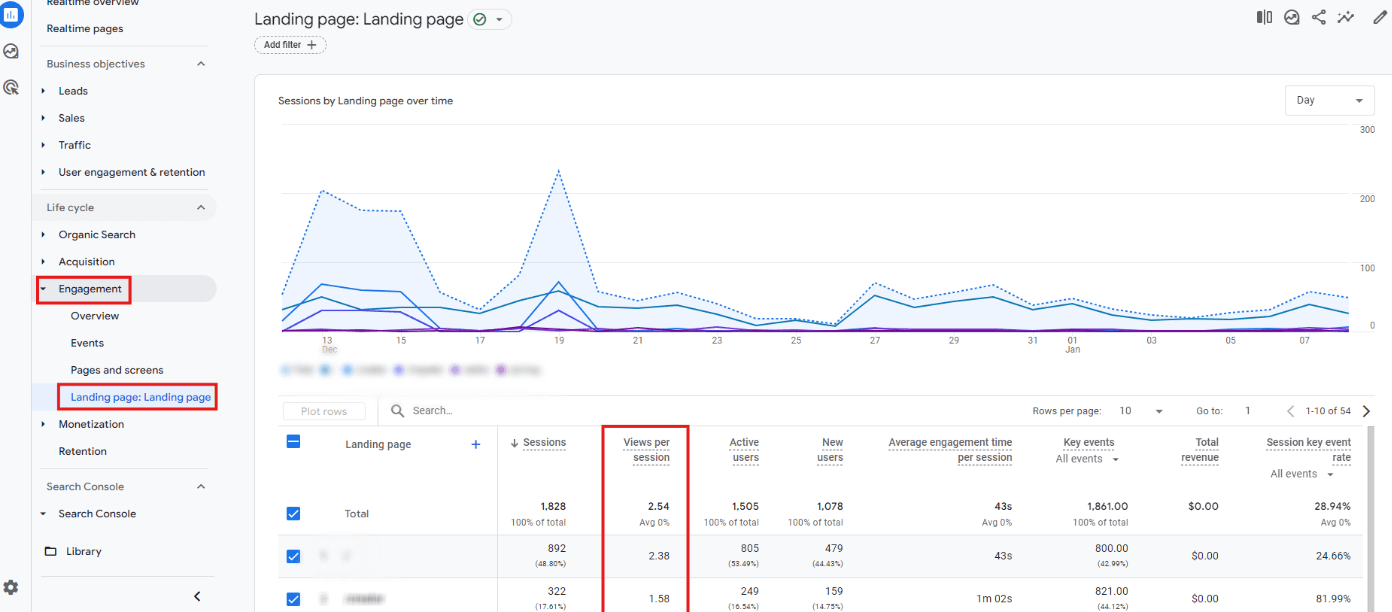
Pages per session in Google Analytics. Image culled from GA4.com
For single-page websites (which many small businesses use), views per session may not make sense, so it may be worth tracking the next best alternative—average engagement time. This metric captures the total time a user spends engaging with a page.
How to Check Your Website’s Average Engagement Time
If I shared the how-to for each metric, this would be a long-winded blog post, but this one’s special only because it’s the clearest indicator of whether people find your content engaging.
Here’s how to find your website’s average engagement time on GA4:
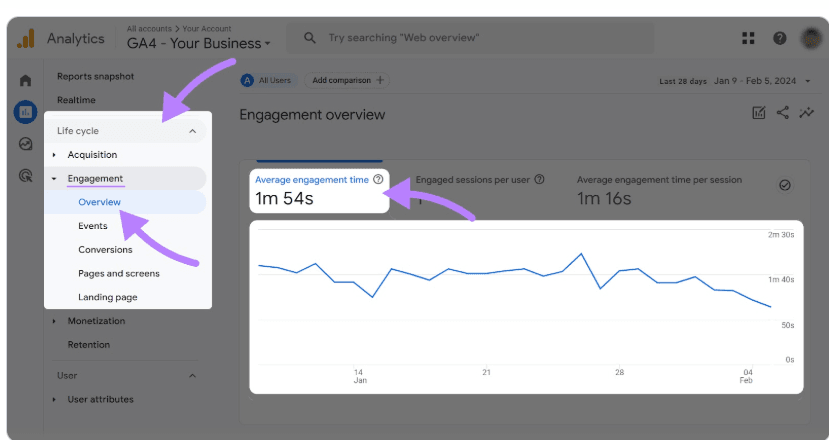
Overall Engagement Time (2 Steps)
- Navigate to the Reports section in the left-hand menu.
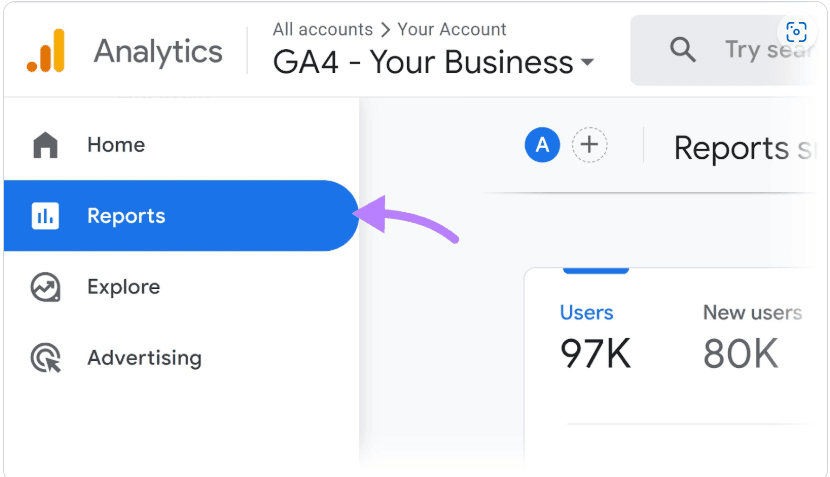
- Select Life Cycle> Engagement > Overview
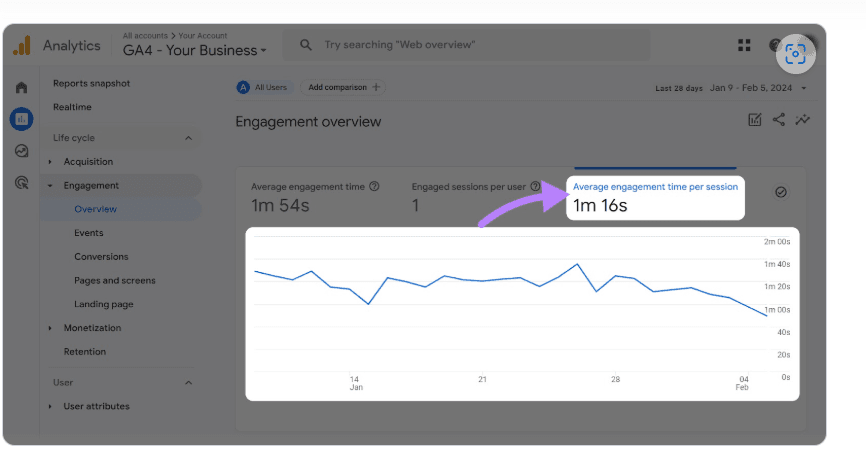
Average Engagement Timer Per Session (1 Step)
This metric differs slightly from overall engagement time since it considers individual sessions rather than total users.
- Within the same Overview section, click on Average engagement time per session.
Some images in this section were culled from Semrush.
2. Traffic & Users
Your website’s traffic tells you much about how visitors interact with your business online. Every traffic channel tells its own story about how potential customers find your brand.
For example, learning that most of your traffic comes from social media might encourage you to try more influencer marketing and user-generated content (UGC). UGC means content created by people rather than brands or businesses. Whenever a customer drops a positive review on Yelp or joins in on a hashtag campaign, they create UGC.
At the same time, it’s essential to break down traffic to the users who create it. You should know your users’ key demographic and behavioral patterns.
Are your visitors local, national, or international? Do they access your website more via mobile, desktop, or tablet? Are the bulk of your users new or returning visitors?
More desktop users could, for example, mean an older audience or folks who just like work.
Traffic metrics to observe include:
Traffic Source
Healthy businesses drive significant traffic, but the type of traffic matters more.
A reasonably accurate picture of each traffic source can help analyze your current website performance and track the effectiveness of your marketing efforts.
You may, for example, aggressively run SEO for your city, but traffic is coming from a neighboring town.
Once the data shows that people elsewhere connect with your content, you can zero in and take advantage. These little details matter.
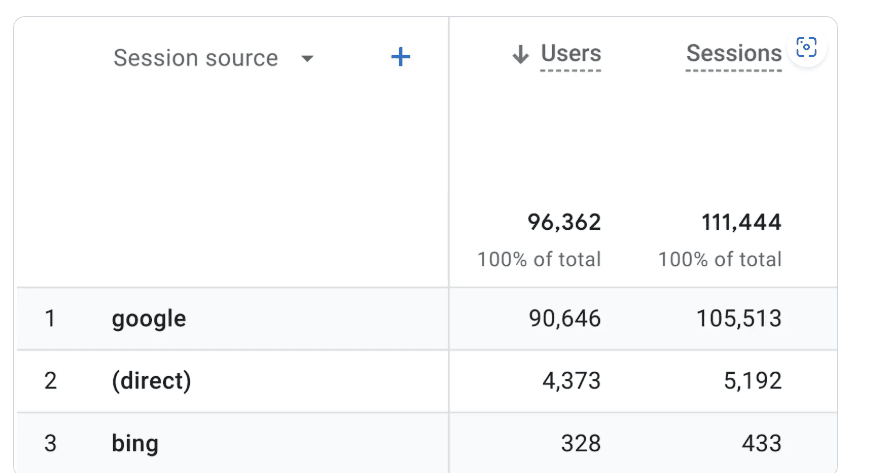
The table below shows 111,444 sessions in total, and under the Session Source column, you can see where the users are coming from.
Most Common Traffic Sources for Small Businesses
Organic Search
Visitors who find your website via unpaid search engine results.
What It Means for Your Business
- Indicates the effectiveness of your SEO strategy.
- A strong organic presence reduces dependency on paid advertising.
Paid Search
This covers visitors from ads placed on search engines (e.g., Google Ads).
What It Means for Your Business
- Offers immediate visibility in competitive markets.
- Requires a budget, so ROI (Return on Investment) tracking is essential.
- Helps target high-intent customers actively searching for your products/services.
Direct Traffic
Visitors who type your website URL directly into their browser or use bookmarks are included. This category also contains visitors accessing your website through offline marketing efforts like business cards or billboard ads.
What It Means for Your Business
- Indicates brand recognition and loyalty.
Referral Traffic
Visitors coming from links on other websites.
What It Means for Your Business
- Shows the effectiveness of partnerships or mentions on other websites.
- High-quality backlinks can boost both traffic and SEO rankings.
Social Media Traffic
Visitors arriving via social media platforms like Facebook, Instagram, or LinkedIn.
What It Means for Your Business
- Shows the general interest and engagement with your brand.
- Contrary to what many people think, social traffic can really drive conversions today.
Email Traffic
Visitors click links in your email campaigns or newsletters. A personal favorite, multiple studies say that email traffic leads to purchases over 4% of the time. That’s two times better than search engines and six times better than social media.
What It Means for Your Business
- A reliable way to engage existing customers and nurture leads.
- Often generates high-quality traffic with strong purchase intent.
Display/Native Ads Traffic
This covers visitors from display ads or sponsored content on websites and apps. They are often placed on high-traffic websites as part of a broader ad network like Google Display Network.
What It Means for Your Business
- Typically builds brand awareness or helps you promote special offers.
Affiliate Traffic
Visitors driven to your site by affiliate marketers promoting your products/services.
What It Means for Your Business
- Provides a performance-based way to drive sales (you pay only for results).
- Lets you reach an established audience powered by the affiliate’s network.
How to Check Traffic Sources in Google Analytics
- Start by selecting “Reports” in the left-hand menu of your Google Analytics dashboard.
- Expand the “Acquisition” section under the “Life cycle” category and click on “Traffic acquisition.”
- Once there, you’ll see your traffic data organized by the Session default channel group. This view categorizes your website traffic based on channels like organic search, direct, referral, and paid search.
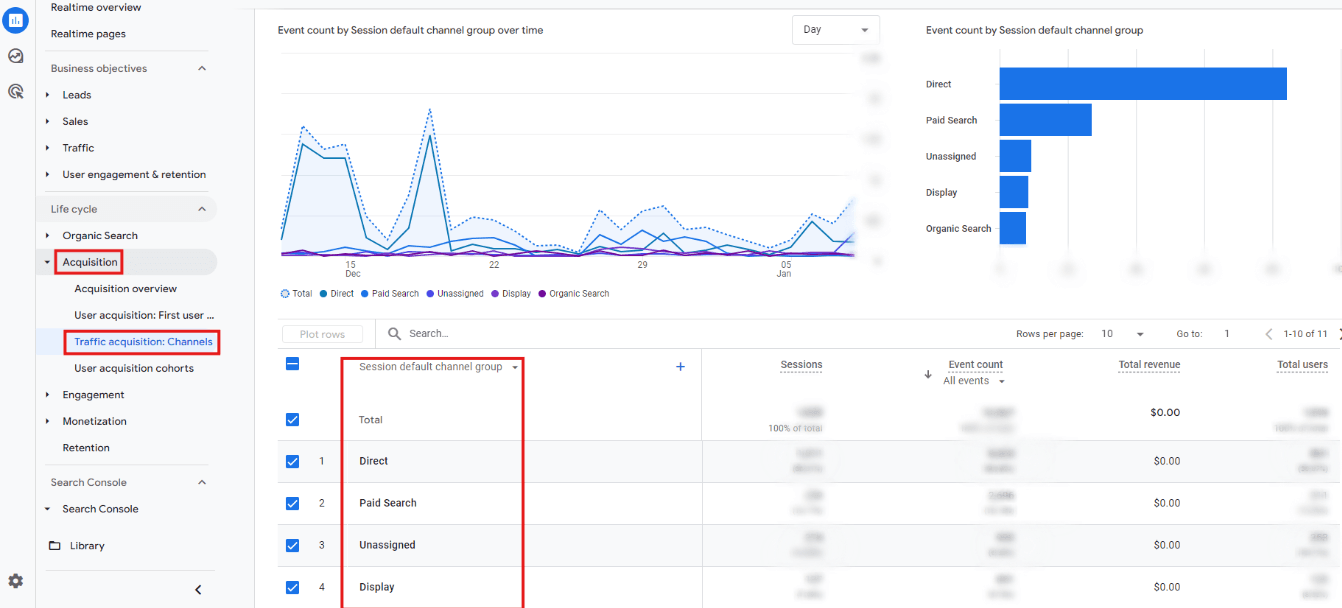
- Want to focus on specific metrics? Click the small arrow to the left of any column header to sort your data. By default, the table is arranged in the User column in descending order.
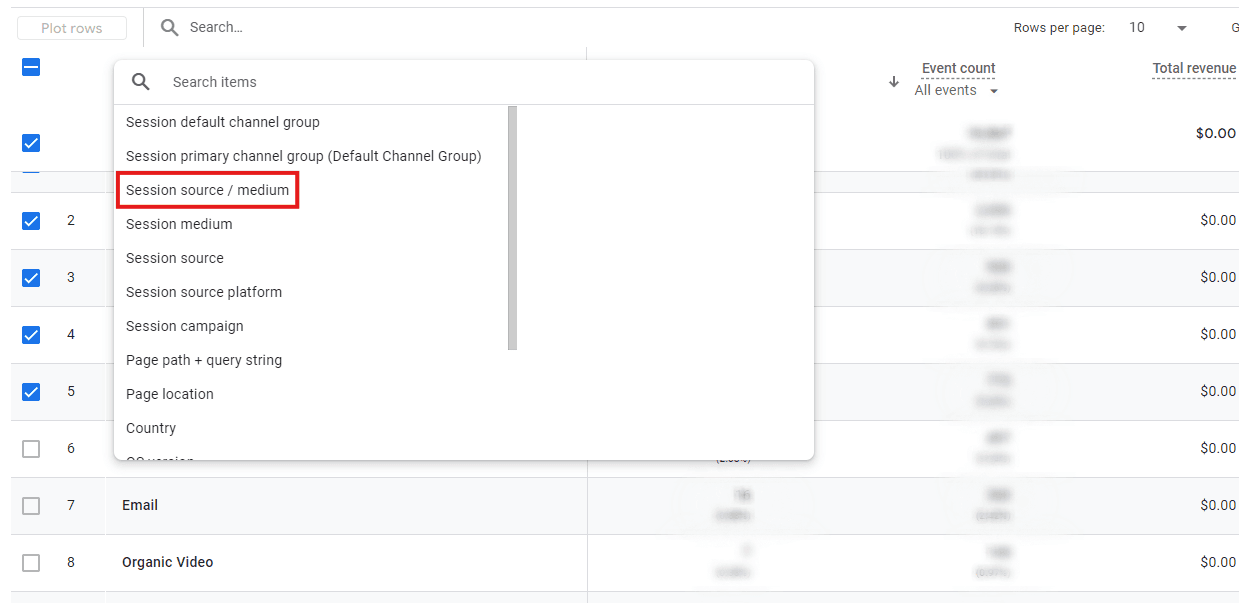
- To refine your view, you can adjust the primary dimension. Click the black arrow next to “Session default channel group” and select a different dimension, such as “Session source/medium.”
Further reading
Google Analytics Traffic Sources: An In-Depth Guide [Semrush]
Engagement Rate/Bounce Rate
An incredibly popular metric, bounce rate captures the percentage of sessions who did NOT engage with your website (or a webpage).
Conversely, if users don’t ‘bounce,’ they are most likely ‘engaged.’ Engagement rate is there the opposite of bounce rate, or the percentage of users who DID engage with your website.
According to Google, an engaged session lasts longer than 10 seconds, has a key event, or has two or more screen/page views.
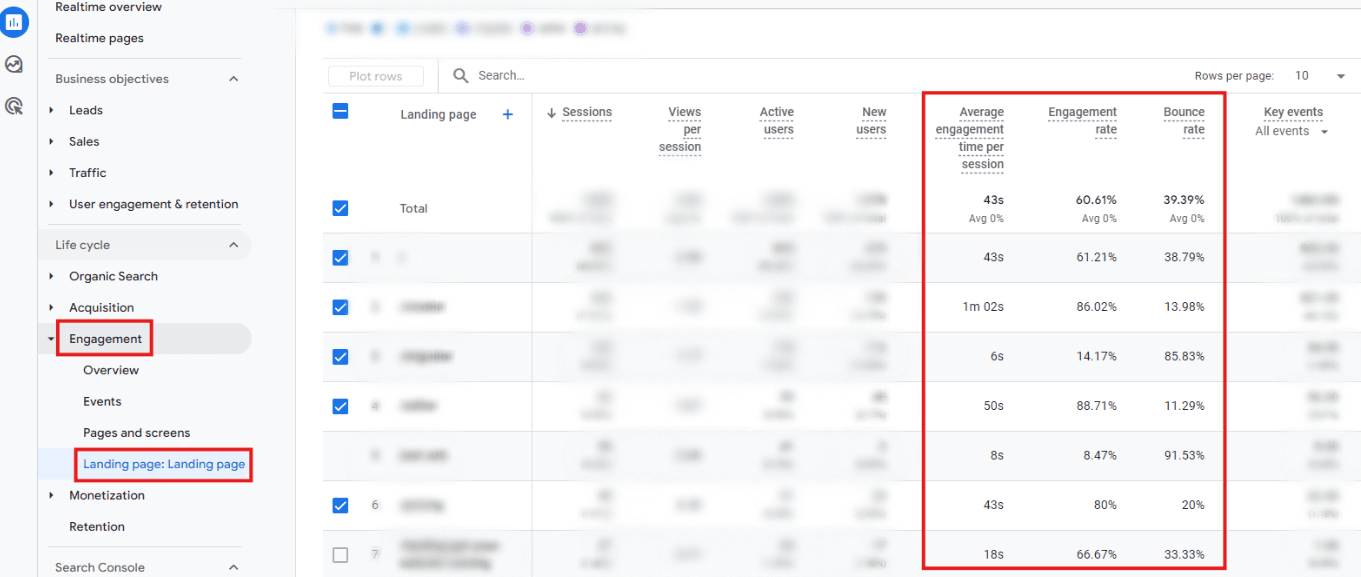
How to Check Engagement and Bounce Rate in Google Analytics
- Go to Reports > Life cycle > Engagement > Landing page.
- You may need to customize the report (follow the same steps as for ‘Views per Session’) and add either of these metrics to the report.
If you notice that a page has a high bounce rate, review the marketing efforts for that traffic channel to ensure there’s no mismatch. It could be that the paid ad ushering them in says ‘Quality Teletherapy in Virginia,’ while the page reads ‘Men’s Therapy in Utah.’
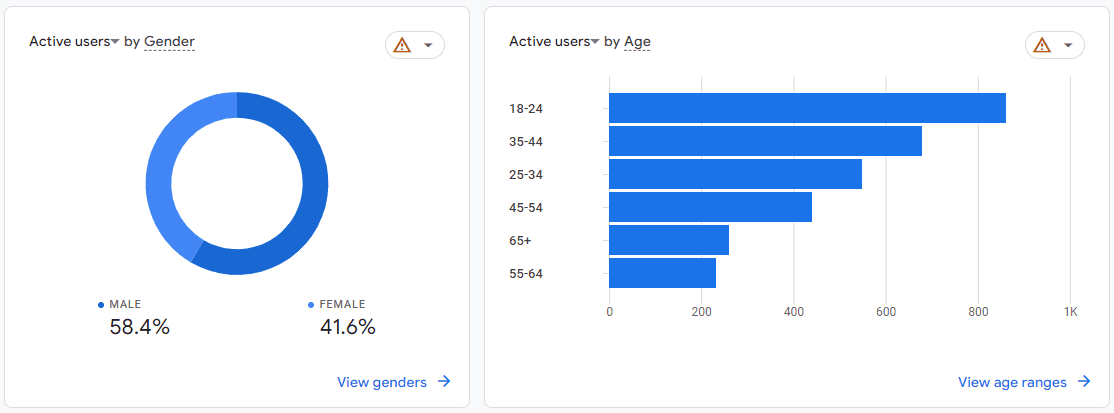
User Demographics
Demographic data explains your customers’ profiles, allowing you to create content relevant to your website’s frequent visitors or change content to appeal to a different group.
You can also use demographic data to create your TCP (target customer profile).
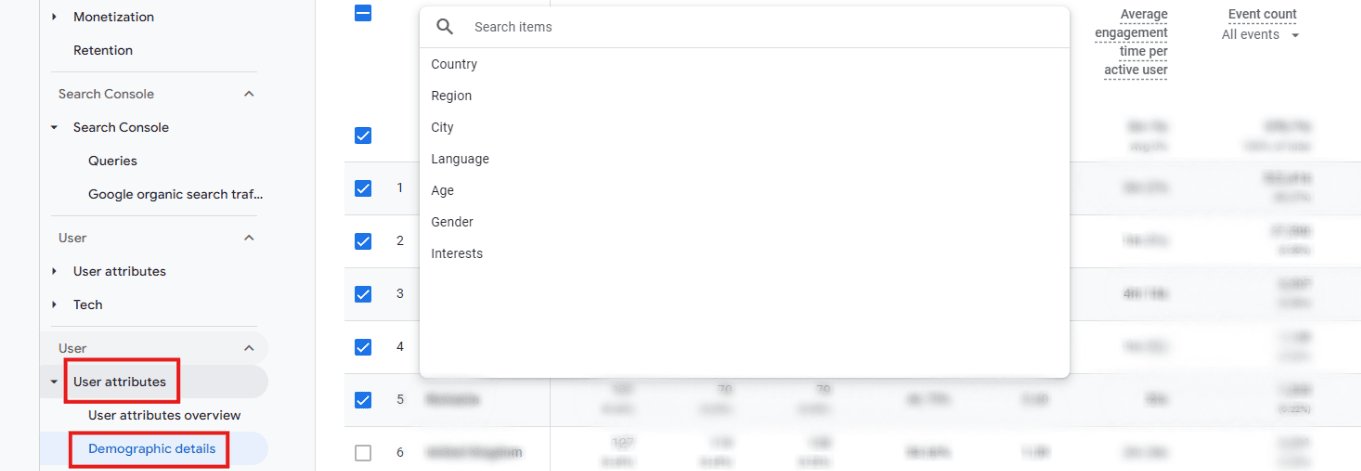
The Demographic Details Report provides key characteristics about the people who use your website, including a user’s language, city, country, age bracket, gender, and even interests.
According to Google, the report includes only aggregated data users who consent to sharing demographic data, i.e., only Google users who have ad personalization turned on.
How to View GA’s Demographic Details Report
Before viewing the report, you must enable your website to collect this data because Google doesn’t run this option by default.
Google Signals is how you do that. By activating it, you ‘enable Google to associate event data collected from consenting Google account user…’
- Sign in to Google Analytics.
- Go to Reports. As we’ve established, it’s on the left side.
- On the left again, click User Attributes > User attributes overview, to see general information on data, such as gender and age.
4. Go to Demographic details to get a closer look at demographic data. You can change the dimension in the dropdown menu to Country, Language, and other interesting parameters.
You can also learn how many new and active users are on your website. Pretty sleek, huh?
3. Visibility
Visibility metrics help you measure and improve how well your business is discovered online.
Focusing on impressions, click-through rate (CTR), and keyword rankings can help you identify gaps and implement strategies to enhance your online presence.
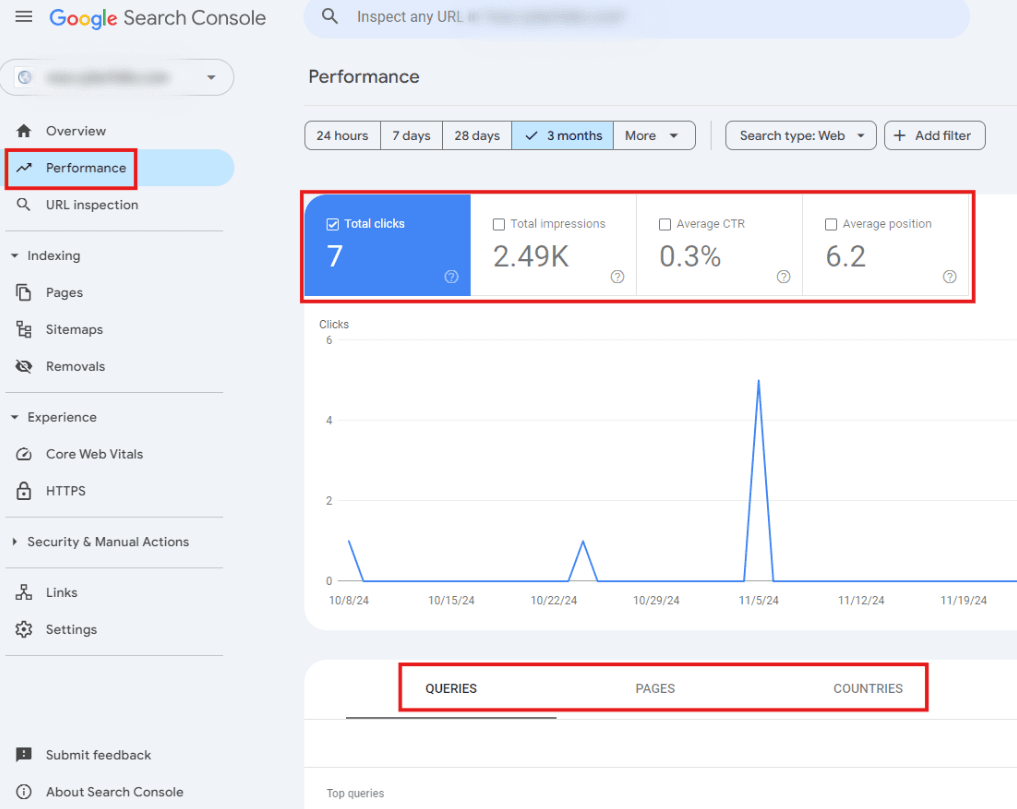
Some key visibility metrics, in this example taken from Google Search Console (also free), to focus on include:
Impressions
An impression is recorded every time your website appears in a search result.
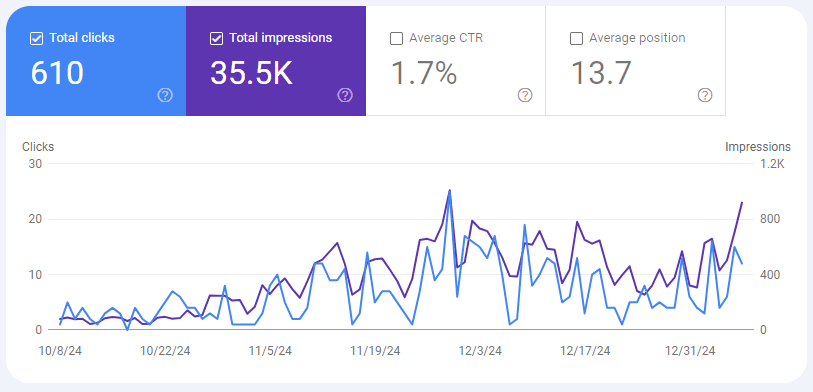
High impression numbers but low clicks? That might mean you need to optimize your meta titles and descriptions to entice users to click.
Click-Through Rate (CTR)
CTR tells you what percentage of users who saw your site in search results clicked through to it.
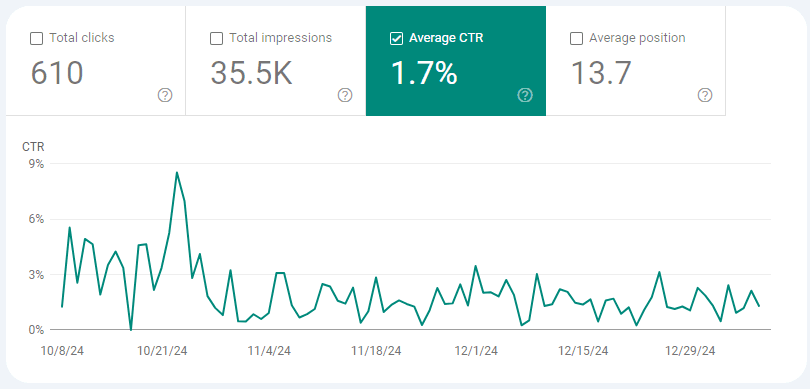
A low CTR might indicate a mismatch between your content and what users are looking for, or it might simply mean your headlines need a little more pizzazz.
Keyword Rankings
Track how well your website ranks for specific keywords in search engine results. In Google Search console this data is measured by ‘average position’ across a certain time frame, such as a day or a month.
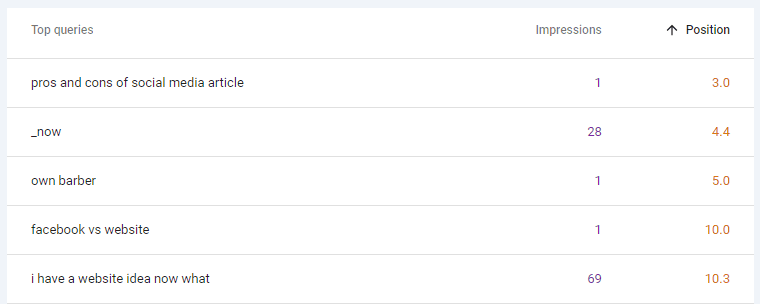
For local businesses, this includes location-specific keywords. Ranking for “best apple pie in Chicago” is more valuable than ranking for “dessert recipes” if you’re running a local bakery.
How to Check Visibility Metrics
Google Search Console (GSC), once set up, is far easier to navigate than GA4. You’ll find all performance-related metrics previously mentioned, by visiting ‘Performance’ in the left-side menu.
Click on any metric in the top bar to plot that data in the chart below, as well as to display that data in the table below the chart.
Further reading
The Ultimate Guide to Google Search Console in 2024 [Hubspot]
How to Set Up Google Analytics
Again, you only need Google Analytics as a small (or micro) business to do most of the essential web analytics.
But you’ve got to have it set up first. Here’s a short guide to doing so:
Step 1: Create a Google Analytics Account
First things first, you need a Google account. Hard not to have one these days.
Head to the Google Analytics website and sign up. If you’re already logged in, you can use your existing account.
Step 2: Add Your Website Details
Once you’ve signed in, Google Analytics will prompt you to add the website details you want to track.
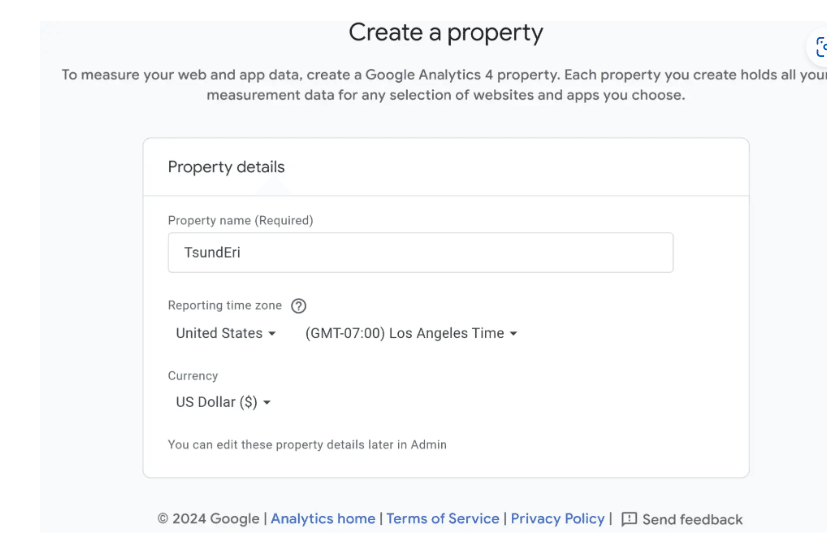
You’ll need to input:
- Website Name: This could be your business name or blog name.
- Website URL: Ensure it’s entered correctly (with the proper HTTP/HTTPS protocol).
- Industry Category: Pick the one that best aligns with your business.
- Time Zone: Choose the time zone where your business operates.
Step 3: Set Your Tracking Objectives
Next, Google will ask what you want to track.
Are you interested in website traffic, lead generation, or e-commerce activity? For most small businesses, starting with traffic or lead tracking works well.
Step 4: Identify Your Data Source
Choose where your data will come from. This blog was created with website owners in mind, so your data source should be the website. The other option is an app.
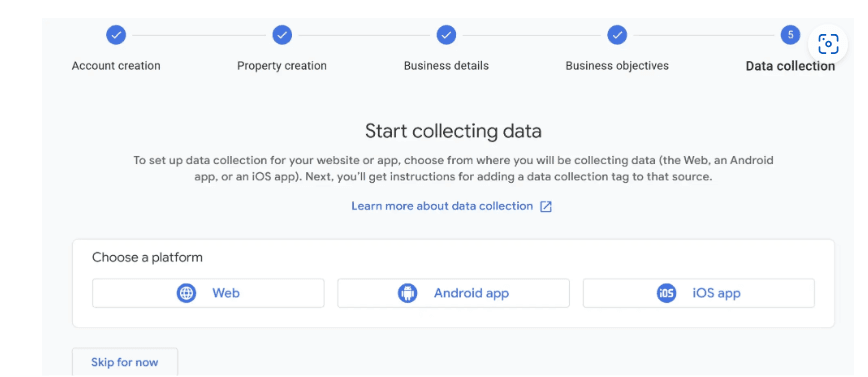
For most, selecting “Website” is the go-to option.
Step 5: Set Up Your Data Stream and Google Tag
Now comes the technical bit. You’ll need to create a “data stream” by entering your website’s URL and assigning a name (keeping it simple is best—your website name will do).
Once done, Google will generate a unique Google tag.
Here’s what you do with the tag:
- Paste it directly after the <head> tag on every website page.
- If you’re using a CMS like WordPress, you can use a plugin to add the tag without touching any code.
- If you’re using _now AI website builder by cyber_Folks, you simply enter the GA4 tag directly in the settings and hit ‘Save.’
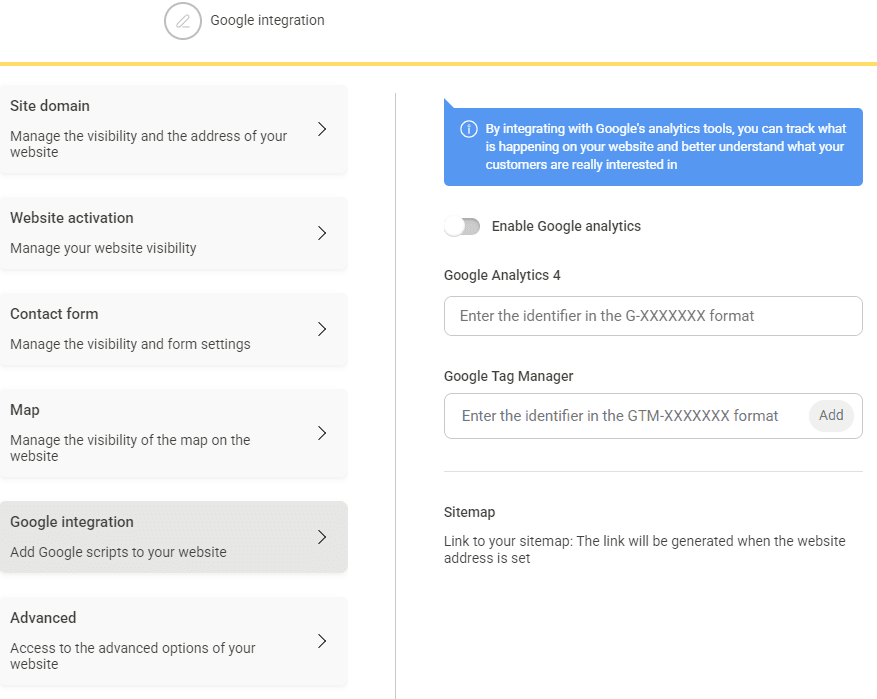
This step is crucial because the tag acts as a data collector, allowing Google to analyze your website’s activity.
Pro Tip: Simplify Tag Placement
You don’t need to manually add the tag to every single page of your site. If your website uses a template system (as most do), simply add the tag to the header section of your templates.
That way, it automatically applies to all pages using the same template.
Step 6: Verify Your Setup
Once your tag is in place, return to Google Analytics and check if it is working. Google provides a handy diagnostic tool to confirm that everything is set up correctly.
Recap
Web analytics might sound like a techy buzzword, but for small business owners, it’s a game-changer. From uncovering where your customers come from to understanding their online behavior, web analytics provides the tools to make informed decisions that truly matter.
This guide covered the essentials, from setting up Google Analytics to leveraging key metrics like traffic sources, engagement rate, and conversions.
The takeaway? You don’t need a giant budget or advanced skills—just the correct data and a willingness to learn. Ready to turn your website into your best business asset? Start analyzing today!

0 comments